Honeypot on Windows Server

A small introduction to Honeypots
A honeypot is a controlled and safe environment to show how attackers work. Used to analyze different types of threats. A honeypot is a decoy that looks like a real application to lure cyber attackers. Honeypots contain logging software like Grafana or Elasticsearch to log all the activity that’s happening on the application. This data can be used to optimize the real application. The attackers also stay within this honeypot, because they think they broke into the site, but it was build to have this happen. This keeps your real site from being attacked.
What we will be building
We will build a honeypot on a windows server 2019. The honeypot will contain the logging software of Grafana and Loki to see the activity on the website.
Grafana Stack
Grafana is an open-source analytics and visualization web application. It provides charts; graphs, and alerts for the web when connected to supported data sources. This will be our place to check the logs of the React application.
Loki is a log aggregation system designed to store and query logs from your application. Here are some resources to learn more about Loki and Grafana.
- https://grafana.com/docs/loki/latest/getting-started/
- https://grafana.com/tutorials/
- https://grafana.com/docs/loki/latest/clients/promtail/
Promtail is to send logs from your site to Loki.
Setting up the environment for the POC honeypot
Create your site on the windows server
First we start by creating our site on the server.
Add the Internet Information Service (ISS) feature
Start by opening the server manager and clicking add roles and features.
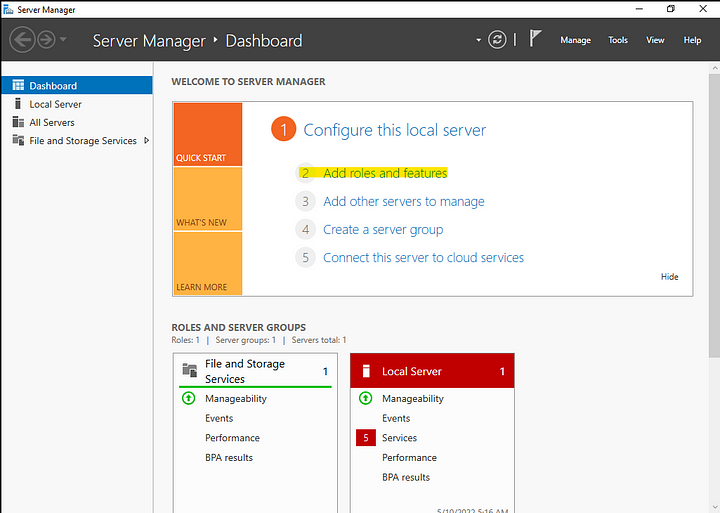
Click next and keep everything as default until you get to the server roles. Here you’ll select Web Server (IIS).
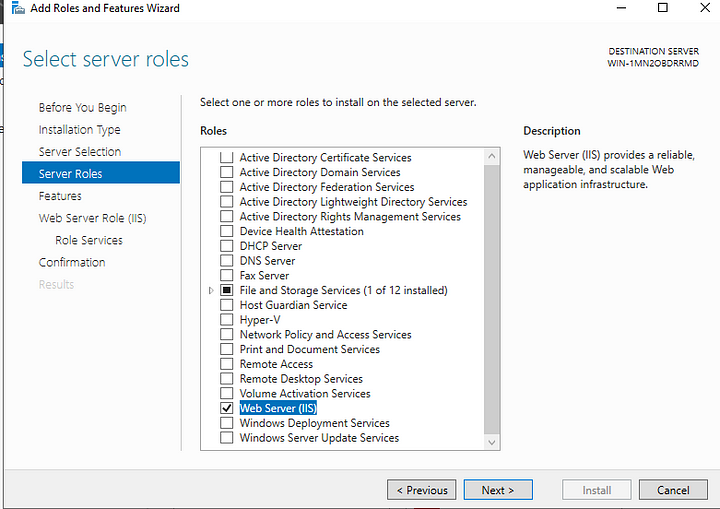
After you added this role continue clicking next and then install.
Creating a site
Open the ISS manager via the search bar. In the manager, you’ll find a folder “Sites” with a default site in it. Create a new site by right-clicking this folder.
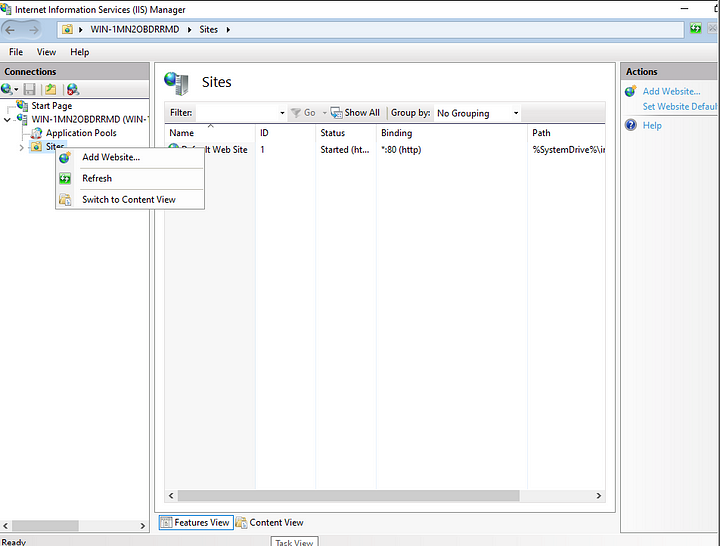
Enter a name for your site and the location of the folder where your site is located. You can choose a different port if you want to.
Creating the logging system
We will be using Grafana, Loki and Promtail.
Installing Grafana
Let us download Grafana here.
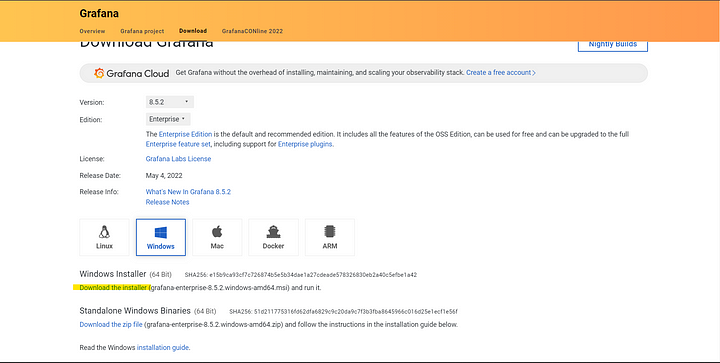
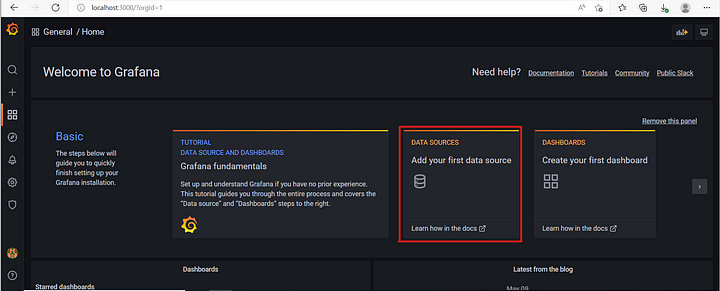
After you’ve downloaded this, install it. Grafana will be running on port 3000 so you should be able to surf to http://localhost:3000. The default login is
- username → admin
- password → admin
Installing Loki and Promtail
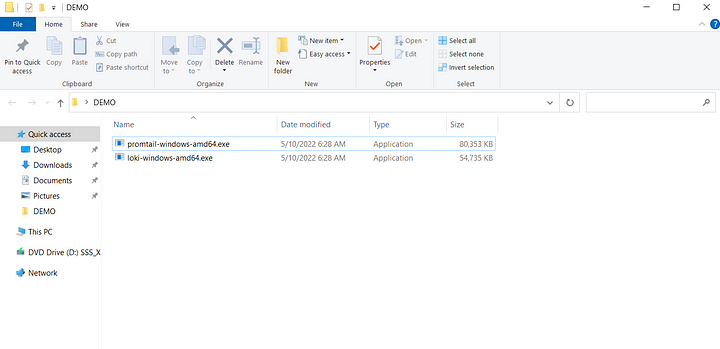
Download Loki here and Promtail here. Extract both zips into the same folder.
Go in powershell to this folder with cd. enter the command.
notepad loki-config.yamlPaste this code inside
auth_enabled: false
server:
http_listen_port: 3100
grpc_listen_port: 9096
common:
path_prefix: /tmp/loki
storage:
    filesystem:
    chunks_directory: /tmp/loki/chunks
    rules_directory: /tmp/loki/rules
replication_factor: 1
ring:
    instance_addr: 127.0.0.1
    kvstore:
    store: inmemory
schema_config:
configs:
    - from: 2020-10-24
    store: boltdb-shipper
    object_store: filesystem
    schema: v11
    index:
        prefix: index_
        period: 24h
ruler:
alertmanager_url: <http://localhost:9093>
Let’s take a look at the content the config file contains.
- auth_enabled enables authentication through the X-Scope-OrgID header.
- server configures the server of the launched modules.
- http_listen_port HTTP server listen port
- grcp_listen_port gRPC server listen port
- ring configures the ring the lifecycler connects to
- ruler The ruler is responsible for continually evaluating a set of configurable queries and peforming an action based on the result
Now do the same for Promtail.
notepad promtail-config.yaml
server:
http_listen_port: 9080
grpc_listen_port: 0
positions:
filename: /tmp/positions.yaml
clients:
- url: <http://localhost:3100/loki/api/v1/push>
scrape_configs:
- job_name: system
static_configs:
- targets:
- localhost
labels:
job: sitelogs
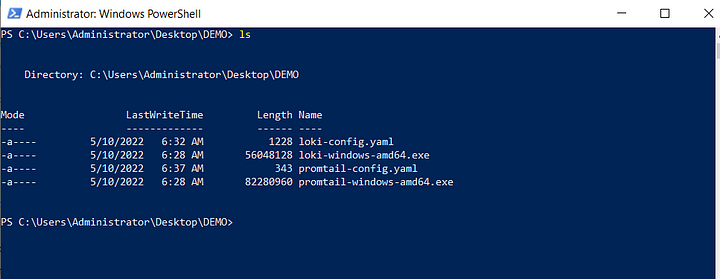
__path__: C:\\inetpub\\logs\\LogFiles\\W3SVC2\\*log #The location of the logsAfter all this, if you type ls you should have something like this.
Run Loki and Promtail
In powershell run
.\\loki-windows-amd64.exe --config.file=loki-config.yamlThis will run Loki with the configurations we gave it earlier.
Now open a new powershell window while keeping the other one open.
Go to the same folder again and execute this code to run promtail.
.\\promtail-windows-amd64.exe --config.file=promtail-config.yamlConnect to Grafana
Go back to Grafana and click on data sources.
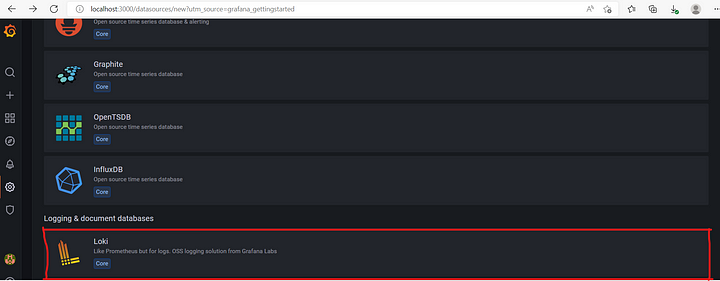
Now click on Loki.
Fill in the URL with the URL to Loki.
<http://localhost:3100>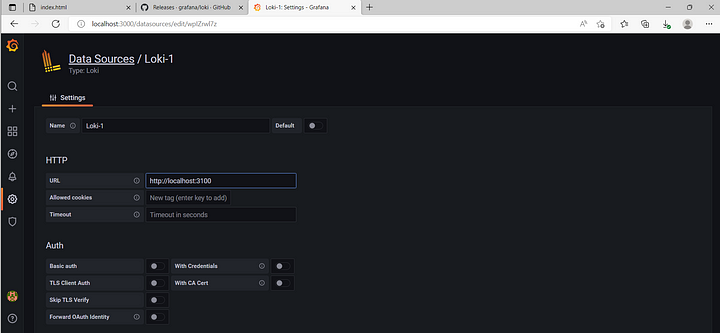
Then click save & test.
Using Grafana
Now lets go to the dashboard.
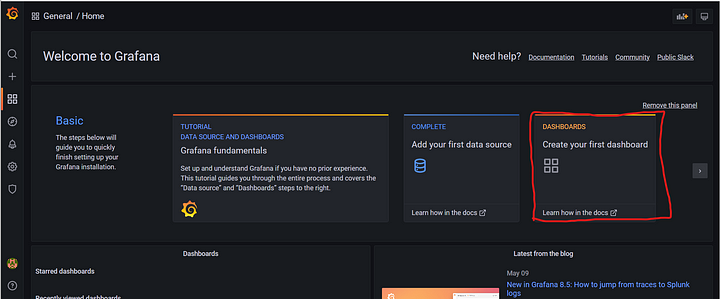
Add a new panel.
Here you can filter the logs to get the most useful info. For example, showing all “GET” requests.
{job="sitelogs"} | = "GET"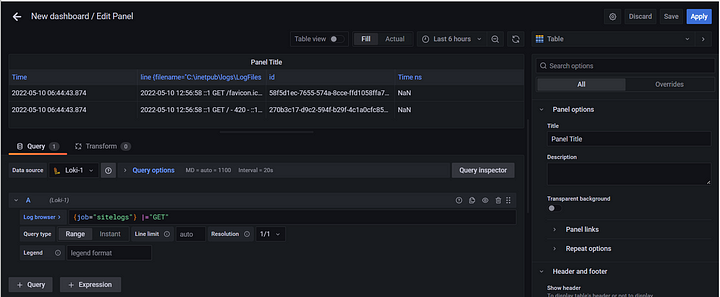
You can then click apply to save it to the dashboard where you can see all panels.
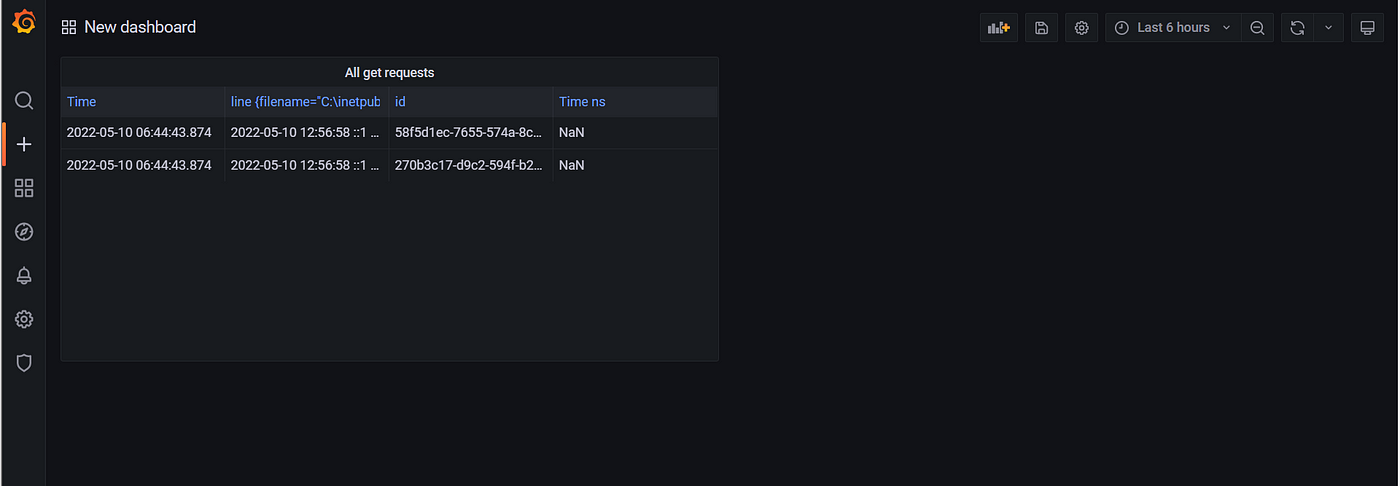
If you place the right panels you will have a quick overview of all traffic on your site and you will be able to find people doing weird things way quicker. a useful metric would be to check on status codes for example to see ip’s that get a lot of 403 status codes. They are probably trying to see something they aren’t supposed to. You can then filter out that IP address and see all the traffic this person is doing and see if this ip exploited a vulnerability. With this information, you can patch it up on your main website.
conclusion
You now have a complete honeypot running on your windows server. This however is just a concept of how it would work since the website we used isn’t ideal for it you can’t get a lot of interesting logs out of it but it made the concept of a honeypot clear. You can experiment further with different websites maybe one with a lot of user interaction. This kind of website is ideal for a honeypot.